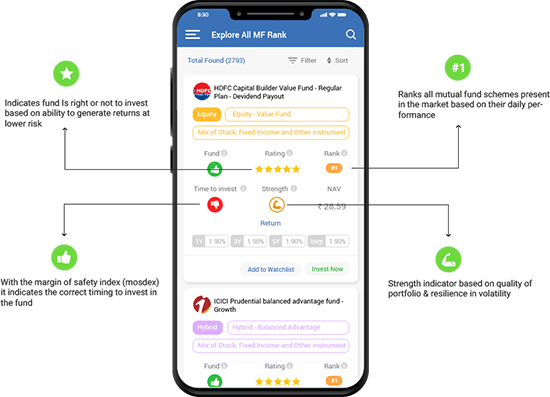

India’s only technology driven research which evaluates 20 million market and fundamental data points to recommend best mutual fund investments.
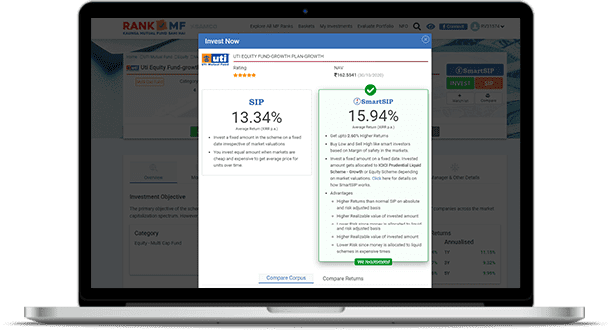
Know moreGet higher returns with RankMF's SmartSIP while maintaining the discipline of regular SIP. SmartSIP intelligently buys, sells and skips your instalments to generate superior returns.
Know moreInvest in expert curated baskets of best mutual funds for financial goals like children’s education, build a corpus, save tax & many more.
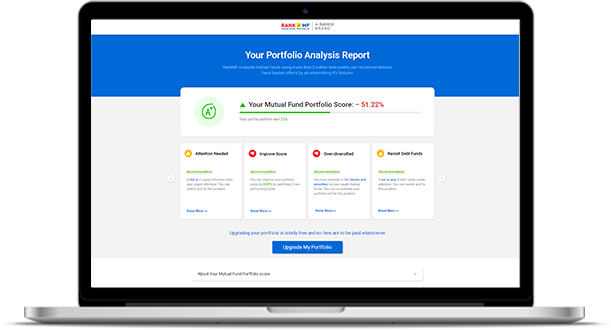
Explore basketsEvaluate your existing mutual fund portfolio score and switch the poor quality schemes holding to good quality schemes with RankMF’s SmartSwitch with single click.
Evaluate your portfolioChoose, invest & manage your mutual fund investments on the go.
Download the App
Trusted by clients for successfully helping them to invest & create wealth via mutual fund investments.
RankMF is a great platform for wealth creation. RankMF team understand your needs and suggest funds that suits you. They also try to balance your portfolio based on Risk and Time horizon. Their Support team is always available to help you with any query. I also have opened account with RankMF for my wife and parents too.
I am using RankMF since 15 months now and I am really happy and grateful to be able to to become my own financial adviser. I would like to appreciate your team for creating such a beautiful and informative platfrom which has helped my to choose and invest in right mutual funds as per my investment habits. The platfrom is so informative that you don't need to look for other financial sources.
I personally appreciate RankMF platform as a No.1 platform and truly appreciate your services and caring attitude towards your customers. I am so grateful for the trust and transparency you’ve placed in with me about RankMF. I have suggested many of my friends and family friends for the satisfied purchase of the fund (like RankMF's Basket) and handsome returns with the same.
ARN-120121
INZ000002535 / INH000005847
MFD-14438 / MFI - 0935
Disclaimer: Investments in Mutual Funds are subject to market risks. Please read all scheme related documents carefully before investing. Past performance is not an indicator of future returns. Read more
There is no guarantee of returns and investors confirm that neither guaranteed returns nor assured returns are being offered to them by RankMF or any of it’s employees or associates.
Past performance may or may not be sustained in the future. Investors are advised to consult their own legal, tax and financial advisors to determine possible tax, legal and other financial implication or consequence of subscribing to SmartSIP order type.
The data or figures mentioned on the RankMF shall not be construed as indicative yields/returns of any of the variants or products of RankMF or SmartSIP.
SAMCO Securities Limited and SAMCO Ventures Pvt Limited. make no warranties or representations, express or implied, on products offered through the platform. It accepts no liability for any damages or losses, however caused, in connection with the use of, or on the reliance of its product or related services.
RankMF is an Mutual fund order collection platform that is integrated with BSE StarMF. All orders collected and placed with BSE StarMF. Investors and clients agree that RankMF/SAMCO Securities Limited are not liable or responsible for and do not represent or warrant for any damages regarding non-execution or incorrect execution of orders with respect to the schemes selected by the clients, but not being limited to, any link/system failure, sufficient/insufficient funds in the trading account which may occur at the end of the client, RankMF/SAMCO Securities Limited or the exchange platform.
Samco Securities Limited is Mutual Fund Distributor registered with AMFI (ARN -120121)
SAMCO Ventures Private Limited - INA000013828
Registered Address: SAMCO Securities Limited, 1004 - A, 10th Floor, Naman Midtown - A Wing, Senapati Bapat Marg, Elphinstone Road, Mumbai - 400 013, Maharashtra, India.
Attention Investors:
"Prevent un-authorized transactions in your account --> Update your mobile numbers/email IDs with your stock brokers and depository participants. Receive information of your transactions directly from Exchange or Depository on your mobile/email at the end of the day. Issued in the interest of investors"
"If the User provides with the e-mail address and phone number, the User agrees to receive periodic messages from RankMF, a Samco Securities Limited Brand with information on new products and services or upcoming events as it may deem fit."
"KYC is one time exercise while dealing in securities markets - once KYC is done through a SEBI registered intermediary (broker, DP, Mutual Fund etc.), you need not undergo the same process again when you approach another intermediary."
"No need to issue cheques by investors while subscribing to IPO. Just write the bank account number and sign in the application form to authorise your bank to make payment in case of allotment. No worries for refund as the money remains in investor's account."
*All Information Contained On The Site Is For General Informational Use Only And Should Not Be Relied Upon By You In Making Any Investment Decision. The Site Does Not Provide Investment Advice And Nothing On The Site Should Be Construed As Being Investment Advice. Before Making Any Investment Choice You Should Always Consult A Fully Qualified Financial Adviser.
* Although Rankmf And Samco Securities Limited Uses Its Reasonable Efforts To Ensure That Information On The Site Is Accurate And Complete, We Cannot Guarantee This To Be The Case. As A Result, Use Of The Site Is At Your Sole Risk And Rankmf And Samco Securities Cannot Accept Any Liability For Loss Or Damage Suffered By You Arising From Your Use Of Information Contained On The Site. You Should Take Adequate Steps To Verify The Accuracy And Completeness Of Any Information Contained On The Site. Read less
Copyright © 2022 RankMF | All Rights Reserved
The difference in performance between funds is as high as 80% which can make selection of mutual funds a complete nightmare. Introducing RankMF - The only Mutual fund Research Engine in India that has Rated and Ranked all mutual fund schemes in India NOT based on past performance. We'll tell you if a fund is sahi (correct) ya nahi (or Not) and we'll tell you why!
RankMF combines data and science to build researched ready made Mutual Fund Baskets. Simply invest in a basket designed to save tax, for retirement, or build a target corpus or simply invest based on your risk appetite or time horizon.
Know Kaunsa Mutual Fund Sahi Hai
Name
Mobile
Already have an SAMCO Account? here
Use your samco client id and back office password to login to your account
Required*
Begin from where you left your account opening application.
Begin from where you left your account opening application.
Account opening is paperless & takes less than 5 minutes!
Login to your existing Investment account